Using Jmp to Draw Sampling Tree
Decision Tree using JMP
Let's plant the Trees and make the Forest!
![]()
There are three types of "Tree" we can use to classify our data:
- Decision Tree
- Bootstrap Forests
- Boosted Trees
These three types of classification's concepts are similar, however, the "Bootstrap" and "Boosted Trees" do something to improve the trees, therefore we can consider the latter two are the advanced versions of "Decision Tree"
Concept
- Step1: Find the maximum Logworth for each variable
Evaluate all the possible partitions for each variable to select the partition with the maximum Logworth to find the place where is the optimal split for each variable.
- Step2: Create the first partition rule
Compare the Logworth of each variable, and select the larger Logworth of variable as the first partition rule.
- Step3: Repeat Step1 and Step2
After creating the first partition rule, do the same process again to find the optimal partition each variable; Keep it continues, until the tree completely build to the point where each node has 100% of the same class
We build the model on the training and balance complexity and accuracy on the validation - Step4: Prune the most complexity model
Prune the tree for each node, and continue pruning until all the subtrees are considered to find out the simplest tree with the best performance on validation assessment.
Building the Model
Analyze ► Predictive Modeling►Partition►Y(Target variable), X(Other variables), Validation(Validation)

Look at candidates
Our raws are going to be separated by Income(101), so the raws' Income≥101 will be one side and the raws' Income <101 will be the other side.

Click split
Based on the plot, we already got a lot of information! We won't put our advertising on the people who have less than 101 income.

Look at the Leaf Report
at Leaf Report we can easily see how the model classify the data so far

Click "Go" and Check Split History
JMP will stop at the point when our model's performance on validation data(Redline) starts getting worse.
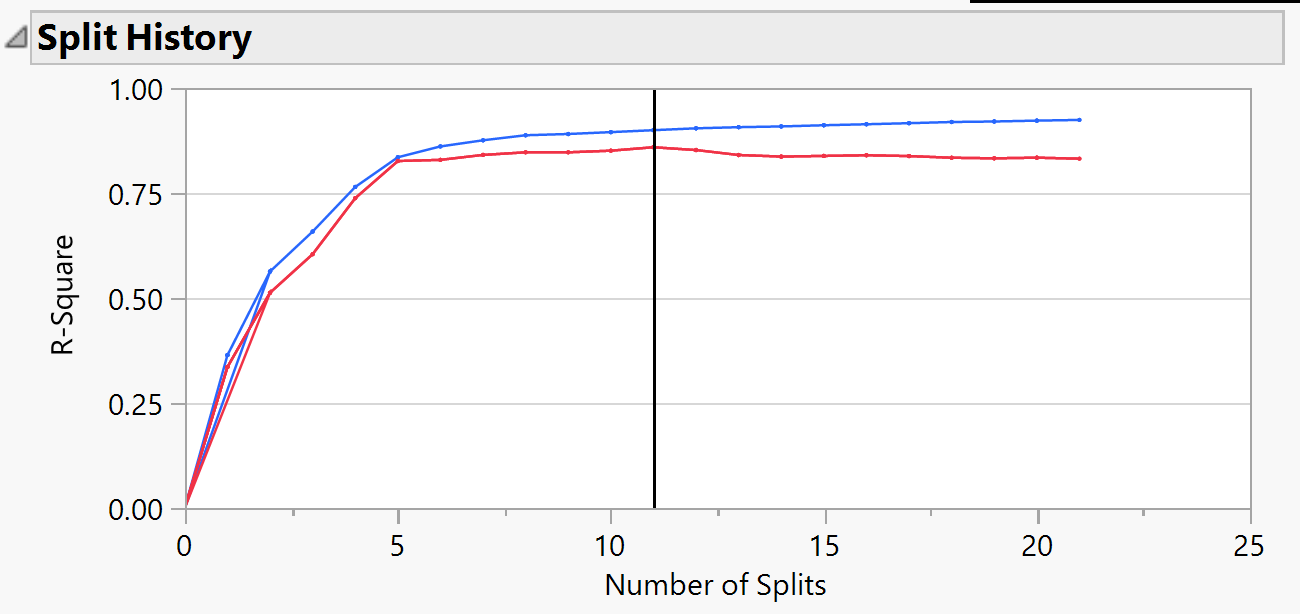
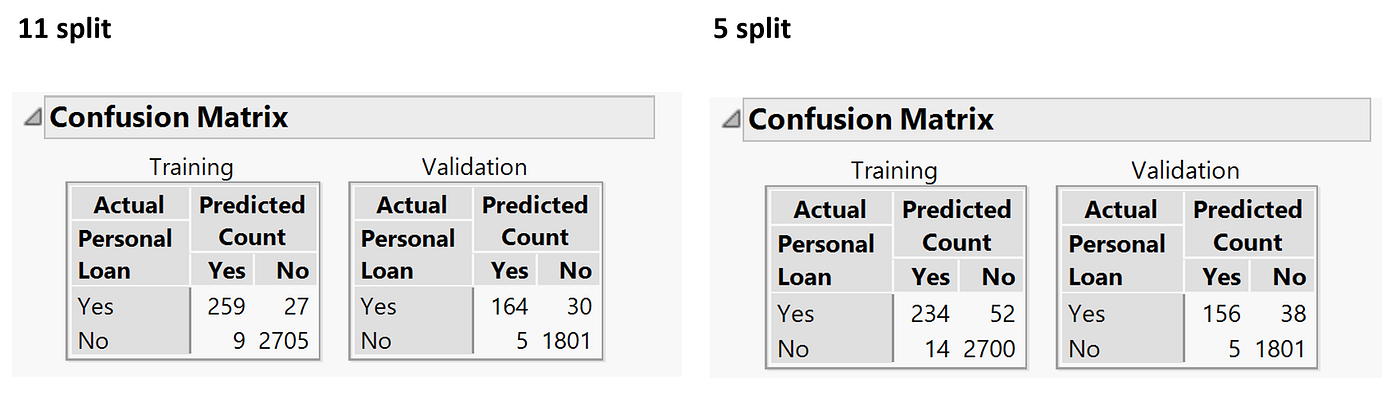
Prune our tree
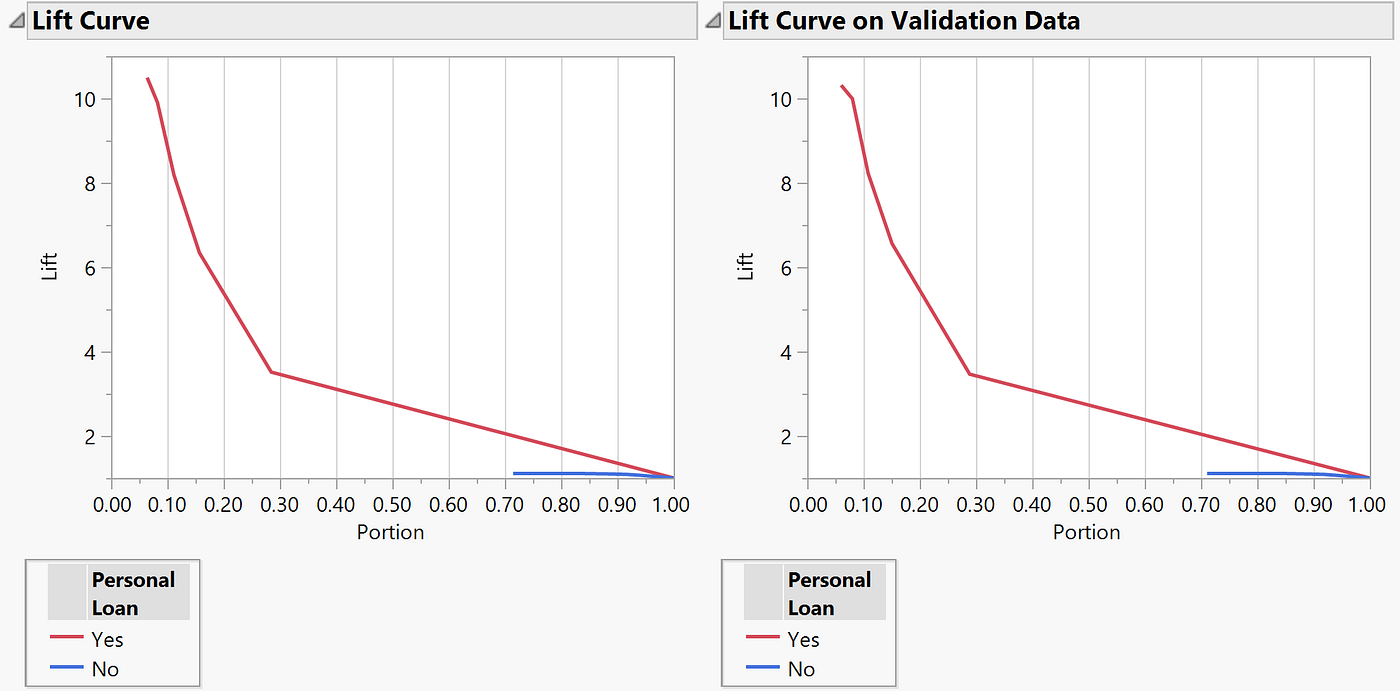
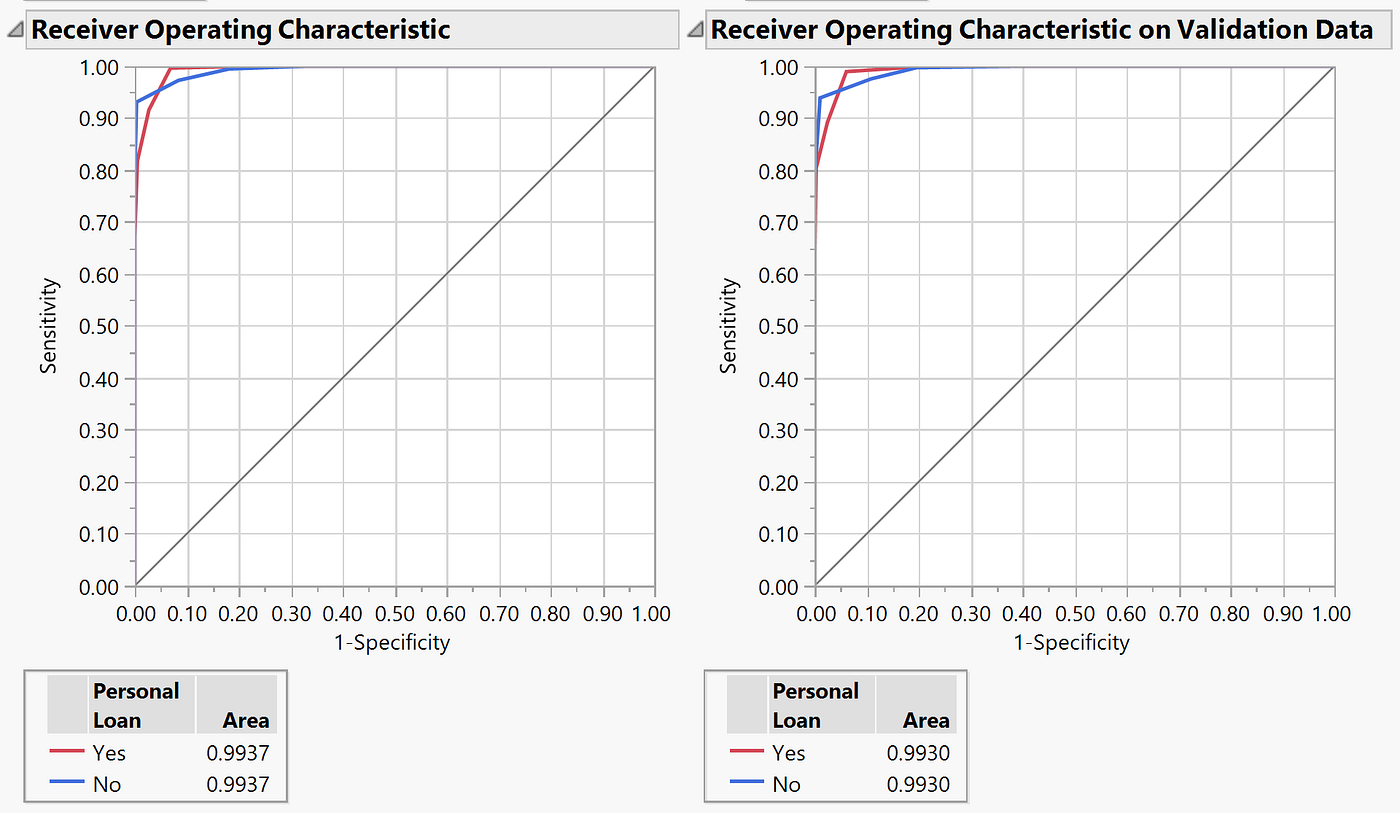
We can see from 5 to 11 the improvement of model performance didn't show a lot different, so we use the confusion matrix to see whether we should reduce our complexity by sacrificing our accuracy.
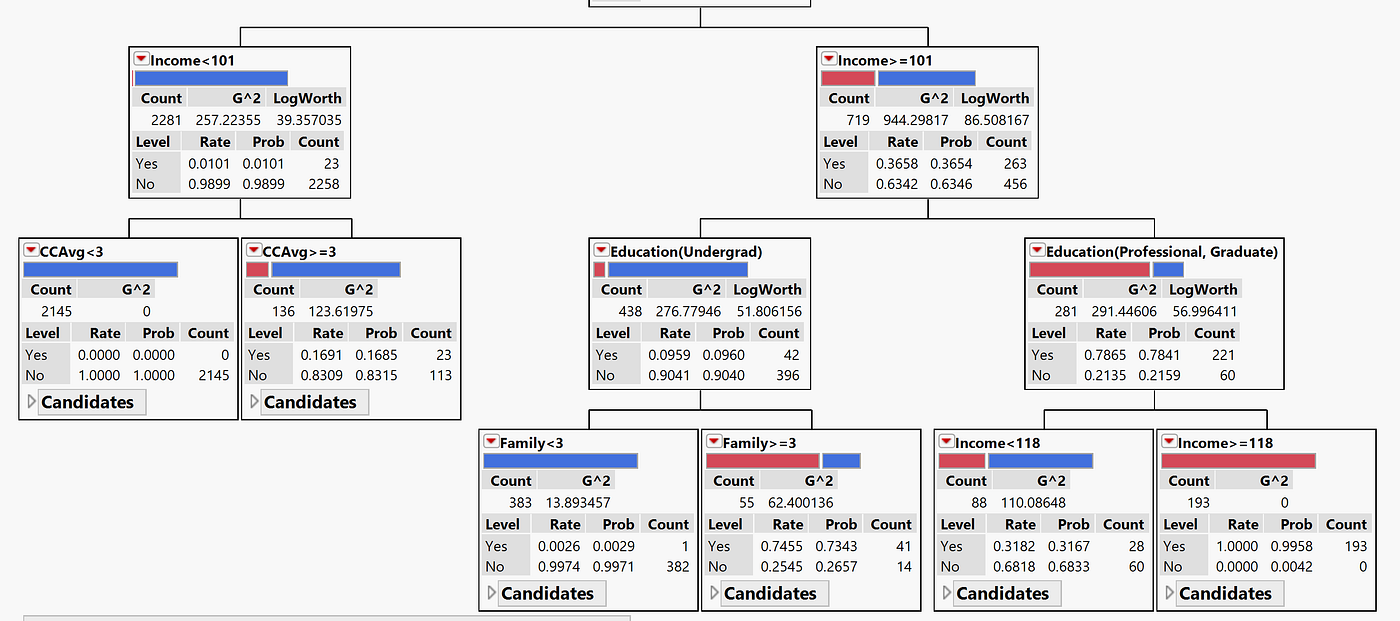
Look at the tree
We can go back to look at our tree, we can get much information from it.
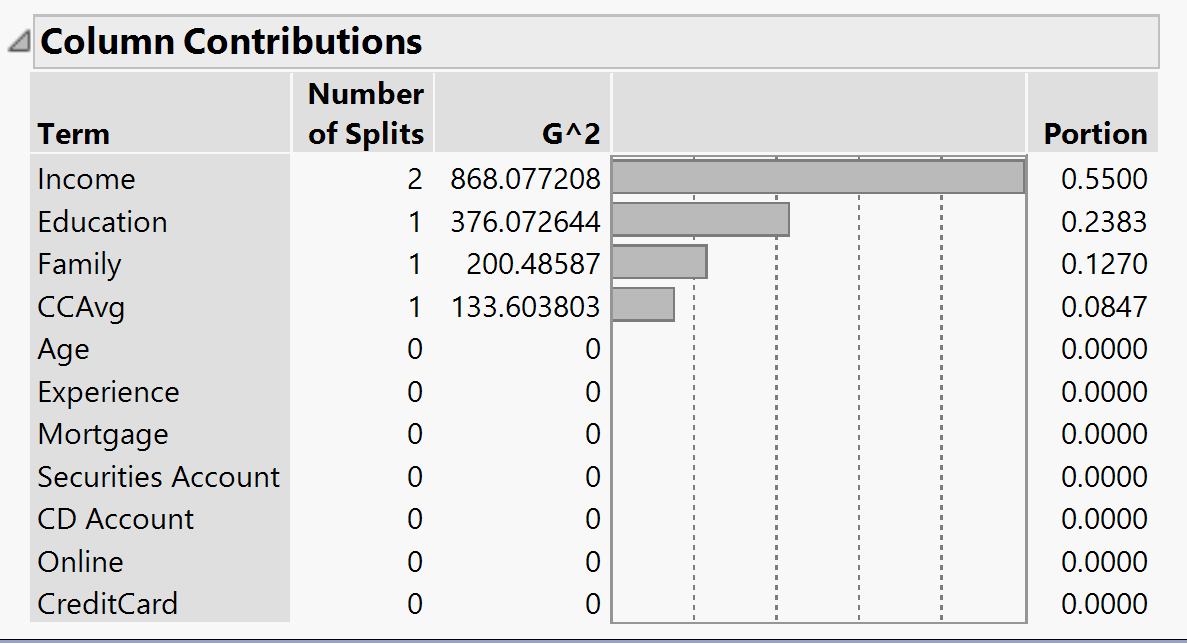
Column Contribution
To see which column contributes the most we can check column contribution. Therefore, we can use it for our variable selection if we have too many variables.
Regression Tree
The most difference between Decision Tree and Regression Tree is the type of target variable, instead of the categorical variable, Regression Tree predicts the continuous variable. The way JMP find the partition is trying to find the biggest differentiation between the averages of records on two sides, instead of find differentiation of proportion.
Pros and Cons
Advantages of trees
- Easy to use and to interpret
- JMP select and reduce variable automatically
- Do not require the assumptions of statistical models
- Can work without extensive handling of missing data
Disadvantages of trees
- May not perform well where there is structure in the data that is not well captured by horizontal or vertical splits. For example, if the data's structure needs the diagonal splits, the trees may perform even worse than not using the model.
- Since the process deals with one variable at a time, no way to capture interactions between variables, we have to create the interaction variables manually.
Ensemble Tree Methods
In order to make our Tree model better, there are two methods to ensemble trees.
- Bootstrap Forests
- Boosted Trees
Bootstrap Forests
Bootstrap randomly sample the data and build a lot of trees then ensemble them to become a forest! This ensemble Tree considers more not so impactful variable than our basic tree. Therefore, some detail information will be captured in the Forest, making the model have the opportunity to perform better.
Boosted Trees
Boosted Trees build the trees to address the previous tree's mistakes. Therefore, each additional tree is specifically tuning to fix the error of the previous layer in the model.
Using Jmp to Draw Sampling Tree
Source: https://medium.com/luca-chuangs-bapm-notes/decision-tree-using-jmp-d61f0f9fd149
0 Response to "Using Jmp to Draw Sampling Tree"
Post a Comment